Every engineering team has a version of the same message in their incident channel, which is a screenshot of an error, a timestamp, and the words "it crashed," and that message is where most investigations stall, because it describes a symptom and asks someone to reconstruct a causal chain from memory, guesswork, and the three log lines that happened to be in view.
The gap between "it crashed" and "here's why" is almost never a shortage of data, it's a shortage of reading capacity, because the stack trace exists, the logs exist, the deploy history exists, and the config diff exists, and nobody has the twenty quiet minutes to line them up against each other. That's precisely the gap an AI assistant can close, and it's also precisely where it will mislead you if you treat its first answer as a conclusion.
So here is what actually happens when you point a model at a failure, the exact tools and commands to collect the evidence, the prompts that produce checkable output, and where it will confidently explain the wrong thing.
Important Disclaimer
This article is intended for educational and engineering purposes only, and it describes general diagnostic practices rather than guarantees. AI-assisted diagnosis produces hypotheses rather than conclusions, and a human must validate every explanation against the evidence before it drives a fix, a post-incident report, or a customer communication.
Never paste production secrets, credentials, customer data, or third-party source code into a model you do not control. The author assumes no liability for misdiagnosis, missed root causes, data exposure, business outcomes, or damages resulting from the use or misuse of this information.
Why "It Crashed" Is a Data Problem in Disguise
A crash report is a symptom, and a symptom has no causal information in it, which is why the first useful move is always to convert the symptom into a bounded timeline.
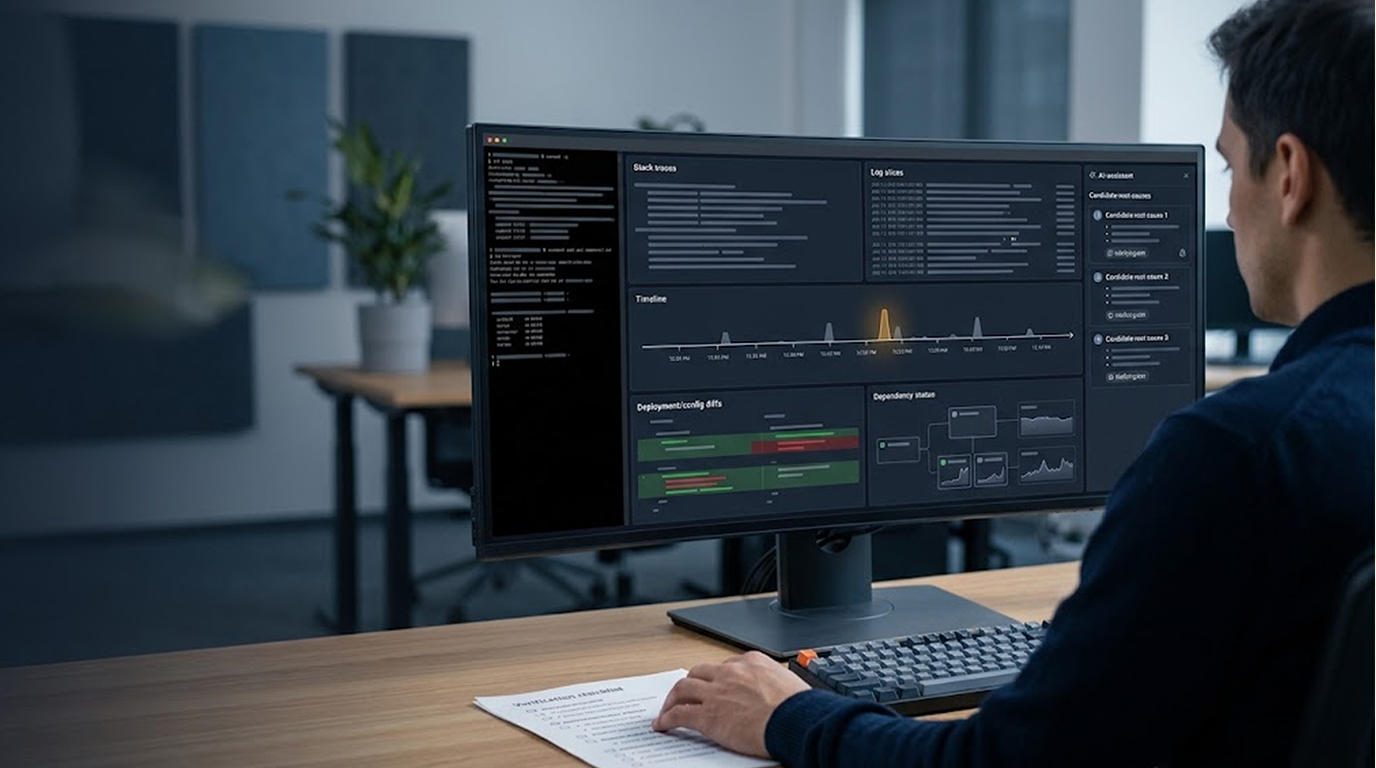
That means collecting four things that almost always exist and rarely get assembled, which are the exact error and stack trace, the deploy and configuration history for the preceding hours, the relevant log slice from a window before and after the failure, and the state of the dependencies the system talks to. Once those four sit in one place, most incidents become explainable, and the explanation usually arrives from something noticing that two timelines overlap.
The AI's role in this is not to know your system, it's to read four documents at once without getting bored, which is a real capability and a genuinely useful one.
Collecting the Evidence: The Actual Commands
This is the part most guides skip, so here is how you actually gather the four evidence sources, with tools you already have.
Get the stack trace from Kubernetes.
kubectl logs deployment/checkout-api --since=2h --previous >
 /tmp/stack.txt
kubectl logs -l app=checkout-api --since=2h --tail=5000 >
 /tmp/logs.txt
Get the deploy history.
kubectl rollout history deployment/checkout-api
argocd app history checkout-api --output json >
 /tmp/argocd-history.json
Get the config diff for the last few hours.
kubectl diff -f k8s/checkout-api/ > /tmp/kubectl-diff.txt
git log --since="6 hours ago" --oneline --name-only >
 /tmp/git-changes.txt
Pull the wider log slice from your aggregator. If you're on Loki:
logcli query '{app="checkout-api"}' --since=2h
--limit=10000 --output=jsonl > /tmp/loki.jsonl
If you're on Elastic:
curl -s -X GET "https://es.internal:9200/logs-app-*/_search" \
  -H 'Content-Type: application/json' \
  -d '{"query":{"range":{"@timestamp":{"gte":"now-2h"}}},"size":10000}' \
  > /tmp/es.json
If you're on Datadog:
datadog-ci logs query --query "service:checkout-api" --from
"2h ago" --to "now" > /tmp/datadog.log
Get dependency status for the same window.
kubectl get pods -n payments --since=2h >
/tmp/payments-pods.txt
curl -s https://status.stripe.com/api/v2/status.json >
/tmp/stripe-status.json
aws rds describe-events --source-type db-instance
--duration 120 --output json >/tmp/rds-events.json
That gives you four files on disk. Now you can feed them to a model.
Feeding the Evidence to a Model: A Copy-Paste Prompt
Here is a working prompt you can paste into Claude, ChatGPT, or any model with a large context window. Replace the bracketed paths with your own files.
You are a senior site reliability engineer. I have four evidence files from a production incident on a checkout API that began at 14:07 UTC today.
File 1 is the stack trace from the failing deployment.
File 2 is the log slice from 12:00 to 16:00 UTC across all replicas.
File 3 is the deploy and config diff from the preceding 6 hours.
File 4 is the status of upstream dependencies (payments, database, auth) for the same window.
Do not offer a theory yet. First, build a single merged timeline of every event across all four files, sorted by timestamp, and mark each event as INSIDE or OUTSIDE the blast radius. Then tell me what changed first.
After the timeline, propose the top three candidate root causes, ranked by fit with the evidence. For each one, give me the specific evidence that supports it, the specific evidence that would rule it out, and the cheapest single test that distinguishes it from the others.
If you need information I have not provided to answer confidently, say so explicitly rather than assuming.
That prompt forces the ordering step, prevents anchoring, and demands falsifiable candidates. The last sentence is doing a lot of work.
The Tools Around the Model
The model is one part of the pipeline, and the pipeline is what makes it useful. Here is the working toolset most teams already have or can add in a week.
|
Tool |
What It's For |
How It's Used in Practice |
|
kubectl / argocd |
Deploy and pod history |
kubectl rollout history, argocd app history |
|
kubectl diff / git log |
Config and code changes |
git log --since="6 hours ago" |
|
Loki + logcli |
Log slicing |
logcli query with --since and --limit |
|
Elastic + curl |
Log slicing |
_search with range on @timestamp |
|
Datadog CLI |
Log slicing |
datadog-ci logs query |
|
Splunk + splunk search |
Log slicing |
index=app sourcetype=checkout earliest=-2h |
|
AWS CloudTrail / aws rds describe-events |
Dependency and infra events |
describe-events with --duration 120 |
|
Grafana / Prometheus |
Metrics at the failure window |
rate(http_requests_total{job="checkout"}[5m]) |
|
jq |
Normalising JSON logs |
jq -r '.[] | "\(.timestamp) \(.level) \(.message)"' |
|
awk / sort -k1,1 |
Merging log timelines |
awk to prefix source, then sort by time |
|
diff / delta |
Comparing config before/after |
git diff HEAD~1 piped into delta |
|
Claude / ChatGPT / Gemini |
Reading four sources at once |
Paste the assembled evidence with the prompt above |
|
Cursor / Copilot |
Diagnosing code-path issues |
Open the file, ask "trace this value from request to crash" |
|
pytest / a throwaway script |
Running the distinguishing test |
pytest tests/test_timeout.py -k "checkout" |
The Timeline Trick, With Commands
The merged timeline is the step that finds most real causes, and you can build a rough one before you even touch a model, using standard tools.
If your logs are line-oriented with a timestamp at the start of each line, here is the old-fashioned way to merge them:
{ cat /tmp/logs.txt ; cat /tmp/kubectl-diff.txt ;
cat /tmp/rds-events.json ; } \
  | grep -E '^[0-9]{4}-[0-9]{2}-[0-9]{2}T' \
  | sort -k1,1 \
  > /tmp/merged-timeline.txt
For JSON logs, extract the timestamp and message first:
jq -r '.entries[] | "\(.ts) [\(.source)] \(.message)"'
/tmp/loki.jsonl \
  | sort -k1,1 \
  >> /tmp/merged-timeline.txt
Then paste the merged file into the model and ask it to spot the ordering. The model's job is to notice that the credential rotation completed at 14:05 and the failures began at 14:07, which is a fact you can verify yourself by reading the file. That is the whole point, the AI is doing the reading, and you are doing the checking.
What the Model Gets Confidently Wrong
- The failure modes in diagnosis are consistent, and the first one is the most expensive, which is that it will produce a complete causal narrative from insufficient evidence and deliver it with the same fluency as a correct one, so a missing log line gets filled in with an assumption that sounds like an observation.
- The second is correlation treated as causation, because a deploy happened four minutes before the failure and that is suggestive rather than conclusive, and sometimes the actual cause is a traffic spike that also happened four minutes before, and the model will not necessarily distinguish between two coincident events.
- The third is confusing the symptom with the cause, so a null pointer exception gets reported as the cause when it's the consequence of an empty response from a dependency, which means the fix lands in the wrong repository and the incident recurs.
- The fourth is overfitting to the stack trace, because the frame where the exception surfaced is often three levels away from where the bad state was introduced, and a model reading only the trace will anchor on the wrong file.
- The fifth is inventing system behaviour, because a model that doesn't know your retry logic, your cache invalidation, or your feature flags will assume a standard pattern, and the assumption will be wrong in exactly the systems where it matters most.
Where the Model Stops and the Engineer Starts
There's a clean boundary worth stating explicitly, because it prevents both over-trust and wasted effort.
The model can tell you what the evidence is consistent with, and it cannot tell you what actually happened, because actuality requires runtime state it has never seen. It can propose a test, and it cannot run it. It can draft the post-incident narrative, and it cannot attest to the accuracy of that narrative. It can suggest a fix, and it cannot know whether the fix addresses the path or merely silences the symptom.
So the engineer's job becomes confirmation rather than discovery, which is a genuinely different and faster job, and the discipline is to refuse to close an incident until a specific observation has confirmed one candidate and ruled out the others.
The Post-Incident Report Is Where AI Compounds
The least glamorous use is the one that pays back repeatedly, which is turning the confirmed explanation into a written record with the timeline, the evidence, the ruled-out candidates, and the change that fixed it.
That record does two things that a chat session never does, because it survives, and because it makes the next occurrence of the same class of failure a five-minute job rather than a two-hour one. It also creates the audit trail that an incident review will ask for, since a conclusion with no recorded evidence is a conclusion nobody can defend six months later.
The practical rule is to write the report from the confirmed hypothesis rather than from the model's original output, because the original output is a draft that may contain three wrong theories and one right one, and publishing it unedited is how a team ends up fixing something that was never broken.
Real Two Scenarios
Scenario 1: The Confident Wrong Answer
The Setup
A service starts returning intermittent 500s after a routine deploy, and an engineer pastes the stack trace and the last fifty log lines into a model and asks what caused the crash, and the answer identifies a null dereference in a recently modified handler with a clear and plausible explanation.
What Happened
The team ships a fix for the null check, the errors continue, and a second investigation finds that the actual cause was an expired credential on a dependency that the handler calls, which produced an empty response, which produced the null, which produced the crash, and the model had described the last link in the chain rather than the first.
The Result
Two days of engineering time went into a fix that silenced nothing, and the root cause was eventually found by pulling the dependency status with aws rds describe-events --duration 120, which was never included in the original prompt.
The Lesson
The model explained the symptom it was shown, because that was all it had, and the missing evidence was the dependency status rather than the code, which is why collecting all four evidence sources before asking is the step that determines the answer.
Scenario 2: The Merged Timeline
The Setup
Another team hits a similar failure and follows a different process, which means assembling the stack trace with kubectl logs --previous, the deploy diff with git log --since, a wider log slice with logcli query, and the dependency status with kubectl get pods -n payments, then merging them with sort -k1,1 before any theory is offered.
What Happened
The merged timeline shows the failure beginning at 14:07, a credential rotation completing at 14:05, and no deploy in the preceding six hours, so the candidate list narrows immediately, and the one confirming test is whether the failing requests all involve the affected dependency, which they do.
The Result
The cause is confirmed in under an hour, the fix is a credential refresh plus an alert on dependency authentication failures, and the post-incident record notes the ruled-out candidates so the next occurrence is faster.
The Lesson
The ordering step did most of the work, and the model's contribution was reading four documents at once without losing track of timestamps, which is exactly the capability that makes it useful and exactly the part that requires no trust at all.
How to Spot an AI Diagnosis You Shouldn't Act On
- It names a cause without naming the evidence. An explanation that doesn't point at specific log lines or timestamps is a guess.
- It stops at the frame where the error surfaced. That's usually the symptom rather than the origin.
- It treats a nearby deploy as proof. Proximity in time is suggestive and never sufficient.
- It offers no way to be wrong. If nothing could rule the theory out, it isn't a hypothesis.
- It invents behaviour you know isn't true. Assumed retry logic or caching is the clearest sign it's reasoning from general patterns rather than your system.
- It explains a cause that doesn't fit the blast radius. If the theory predicts failures on hosts that didn't fail, the theory is wrong.
- Nobody recorded the prompt and the evidence. An explanation you can't reconstruct can't be defended in an incident review.
Quick Reference: The Diagnosis Pipeline With Tools
|
Step |
Tool |
Command or Prompt |
|
Collect traces |
kubectl |
kubectl logs deployment/api --since=2h --previous |
|
Collect logs |
logcli / Elastic / Datadog |
logcli query '{app="api"}' --since=2h |
|
Collect changes |
git / argocd |
git log --since="6 hours ago" --oneline |
|
Collect deps |
kubectl / aws |
aws rds describe-events --duration 120 |
|
Merge timeline |
awk + sort |
sort -k1,1 /tmp/merged.txt |
|
Reason |
Claude / ChatGPT |
The copy-paste prompt in this article |
|
Test |
pytest / curl |
The single distinguishing observation |
|
Record |
Markdown / Notion |
Write the report from the confirmed cause |
The Bottom Line
AI moves a team from "it crashed" to "here's why" by doing the reading that nobody has time for, which means parsing the trace, merging the timeline, proposing ranked candidates, and drafting the narrative, and it does that reliably enough to be genuinely useful while getting the causal direction wrong often enough that its first answer must never be the last word.
The process that works is boring and effective, which is collect all four evidence sources with the commands above, merge them into a timeline before theorising, paste them into a model with the scoped prompt, ask for candidates with their supporting evidence and their falsifying tests, run the cheapest test that splits them, and close the incident only when an observation has confirmed one and ruled out the others.
So the next time a screenshot of an error lands in the channel, don't ask what caused it, pipe the evidence into a merged timeline first, because the answer is almost always sitting in the order of events and the model is very good at ordering things.
FAQ
Can AI actually find the root cause of a crash?
It can find a cause that is consistent with the evidence you provide, and it cannot know what actually happened, because that requires runtime state it has never seen, so treat its output as a ranked hypothesis that a human confirms with a specific observation.
Why does AI often identify the wrong cause?
Because it reasons from the evidence it was given, and if the dependency status or the wider log slice is missing it will fill the gap with a standard assumption, which usually points at the frame where the error surfaced rather than the condition that produced it.
What tools should I use to collect evidence before asking AI?
Use kubectl logs --previous for traces, logcli, Elastic, or Datadog CLI for log slices, git log --since and argocd app history for changes, and kubectl get pods or aws rds describe-events for dependency status, then merge them with sort -k1,1.
What is the most useful first prompt for an incident?
Ask for a merged timeline of every event with timestamps across all sources, sorted in order, marked by blast radius, and ask what changed first, because the ordering step surfaces the answer more often than any theoretical reasoning, and it gives you something you can verify by reading the file.
How do I stop AI from confusing correlation with causation?
Ask it to state what evidence would rule each candidate out, then run the cheapest test that distinguishes between them, because a theory that no observation could falsify is a story rather than a hypothesis, and a pytest or a single curl is usually enough.
Should I publish the AI's explanation in the post-incident report?
Write the report from the confirmed cause rather than from the model's original output, because the original is a draft that may contain several wrong theories alongside the right one, and publishing it unedited is how a team ends up fixing something that was never broken.
Can I paste production logs into an AI tool?
Only with controls, because logs contain personal data, internal hostnames, tokens, and sometimes credentials passed as arguments, so redact identifiers locally with jq or sed, restrict the fields you send, and confirm the provider's retention and training terms before anything leaves your environment.