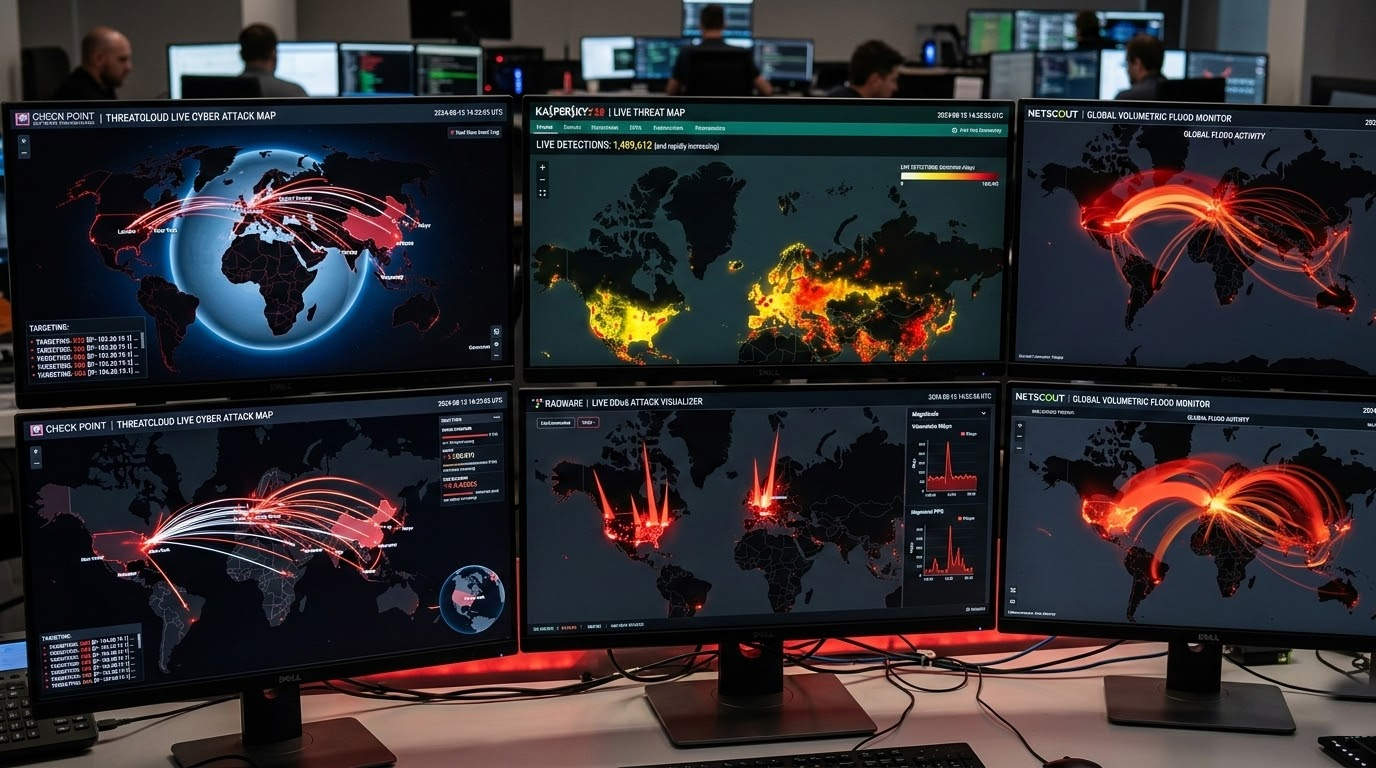
At this moment in March of 2026, hundreds of thousands of cyber attacks happen around the world every hour including instances of malware detection, phishing sites, exploit attempts, botnet Command and Control traffic and DDoS Floods. These examples are gathered through multiple global people / places by aggregating all information from sensors, honeypots and mitigation networks into one common place so that we can see how many cyber attacks are taking place.
Live Threat Maps You Can Check Yourself
These are the most reliable public sources showing near real-time activity (updated every few seconds to minutes):
1. Kaspersky Cyberthreat Live Map
Current snapshot: ~5–6 million detections in the last 24 hours. Top targeted regions: North America, South Asia, Latin America, Western Europe, Southeast Asia. The primary activities being tracked: phishing sites, drive-by download locations, and software being sent to C2 communication with botnets.
2. Check Point ThreatCloud Live Map
Current daily total: ~4 million blocked attacks. Highest attack rates per organization: parts of East Africa, Southeast Asia, Central Asia, South Caucasus, and select Pacific islands. Hardest hit sectors: education, government, telecom, healthcare.
3. Radware’s Live Threat Map
shows DDoS and botnet attacks hourly, comprising mostly TCP flooding (~90%), DNS flooding (~5%), with all other attacks being a combination of fragmented UDP flooding & application. Attacks originated primarily from North America, Northern Europe, and Northern Asia with attacks typically being directed at targets located in North America, Northern Asia, and Southern Asia.
4. NETSCOUT Cyber Threat Horizon DDoS Map
Clean globe view of volumetric DDoS campaigns. Current activity: steady medium-sized floods (10–100 Gbps range) concentrated in North America and Asia-Pacific.
5. Imperva Cyber Risk Attack Map
Highlights web app attack vectors (SQL injection, XSS, bot scraping) have increased substantially in addition to DDoS attacks. Recent trends demonstrate increased web layer attack activity to eCommerce and gov't web sites in North America and Europe.
Quick Tips While Watching These Maps
1. The maps display general trends and regional hotspots; they do not display individual victims' data.
2. If you see a lot of activity in your country/region or sector, ensure that you are fully patched, have MFA implemented, monitor for unusual logins, and scan for exposed ports (with Shodan or Censys).
3. The maps should be used to provide situational awareness, not to raise the alarm.
4. If you see a sudden or large volume of incidents within your industry (education, government, healthcare, finance), this should be an indication to strengthen your defenses.